4.1 Analysis of DCD file by the user’s Fortran programming
Preparation
After the MD simulations, DCD files are obtained as the coordinates trajectory data. Various analysis tools are available in the GENESIS program package. However, these are intended to analyze “major” quantities such as distance, angle, RMSD, etc. If you want to analyze “minor” quantities that cannot be handled by the GENESIS analysis tools, you need to create your own tools or scripts. In this tutorial, we will learn how to analyze coordinates data in the DCD format by editing a simple sample Fortran program. Let’s download the tutorial file (tutorial22-4.1.zip).
# Download the tutorial file
$ cd ~/GENESIS_Tutorials-2022/Works
$ mv ~/Downloads/tutorial22-4.1.zip ./
$ unzip tutorial22-4.1.zip

# Let's clean up the directory
$ mv tutorial22-4.1.zip ./TRASH

# Let's take a note
$ echo "tutorial-4.1: Analysis of DCD by Fortran programming" >> README

$ cd ./tutorial-4.1
$ ls
ionized.pdb  run.dcd  sample.f90
1. What is contained in DCD file?
In the directory, you will find the PDB and DCD files. This is a very small system consisting of one protein (chignolin), water molecules, and ions, with a total of 2,382 atoms. The trajectory consists of 50 frames, generated from GENESIS and processed with the crd_convert tool, with the water and ions wrapped into unit cells.
# Take a look at the trajectory using VMD
$ vmd ionized.pdb -dcd run.dcd
Let’s take a look at the DCD file using the less command.
# Take a look at the contents in the DCD file
$ less run.dcd
DCD files are binary data, and no human can see what is written in them. The reason why we output DCD files is that MD simulations usually generate a large amount of coordinates trajectory data, and we want to keep the file size as small as possible. If the trajectory data is output as text (or ASCII data), the file size will become very large compared to binary. For this reason, trajectory data is usually handled in binary files. There are general rules for the format of a DCD file, so we can know what it contains. The following information is written in the file.
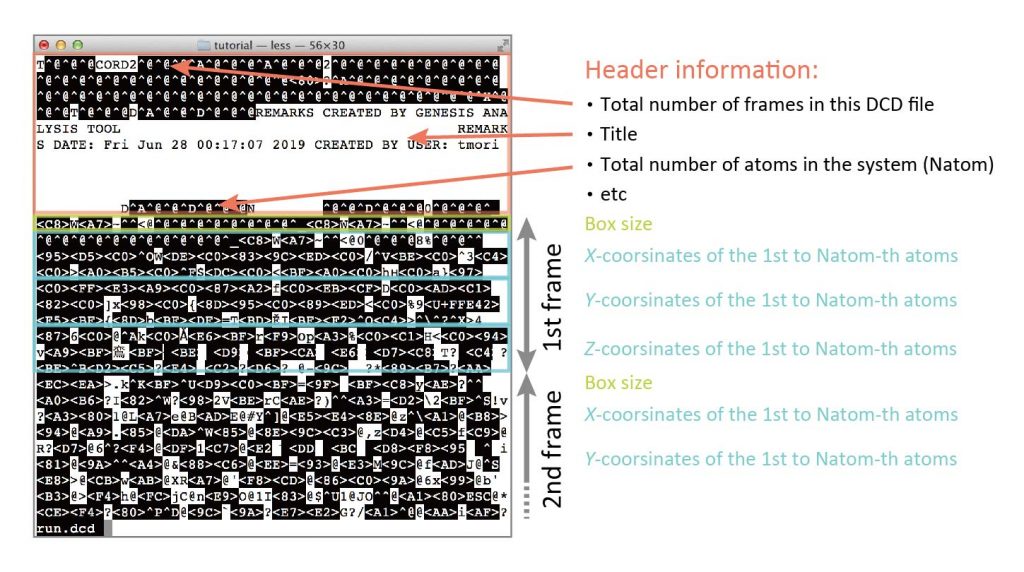
The file contains a header section that describes the total number of frames, the total number of atoms in the system, etc., followed by information about the first frame (box size, x-coordinates of all atoms, y-coordinates of all atoms, z-coordinates of all atoms), the second frame, …, and the final frame. It should be noted that other information such as atomic masses, residue names, atomic names, etc. are not included.
2. Sample program
The directory contains a sample program (sample.f90) written in the Fortran language [1, 2]. If you are not very familiar with programming, please try to understand the program line by line. This program opens a DCD file (run.dcd) and reads the box size and the coordinates of the atoms in each frame, but does not calculate anything. You will see “Analyze the snapshot here” in the program, where you can insert equations and calculations for the analysis of physical quantities. In the next section, we will show an example of editing this sample program to calculate a distance between two atoms.
# View the sample program
$ less sample.f90
! DCD analysis program
!
program main

  implicit none
  integer              :: i, natom
  integer(4)           :: dcdinfo(20), ntitle
  real(4), allocatable :: coord(:,:)
  real(8)              :: boxsize(1:6)
  character(len=4)     :: header
  character(len=80)    :: title(10)

  open(10, file='run.dcd', form='unformatted', status='old')
  read(10) header, dcdinfo(1:20)
  read(10) ntitle, (title(i),i=1,ntitle)
  read(10) natom

  allocate(coord(1:3,1:natom))

  do i = 1, dcdinfo(1)
    read(10) boxsize(1:6)
    read(10) coord(1,1:natom)
    read(10) coord(2,1:natom)
    read(10) coord(3,1:natom)

    ! Analyze the snapshot here

  end do
  close(10)

end program main
In this sample program, the box size of each frame is read in the line “read(10) boxsize(1:6)“. However, if you run the simulation with “boundary = NOBC” (No boundary condition), the box size will not be included in the DCD file. In this case, you need to comment out or delete this line.
This program can read DCD files that are output in little-endian format. Most computers, such as those with Intel CPUs, generate binaries in little-endian format; however, some computers, such as Fujitsu machines, generate them in big-endian format. In the latter case, you need to include convert='big_endian' in the open statement.
3. Distance analysis
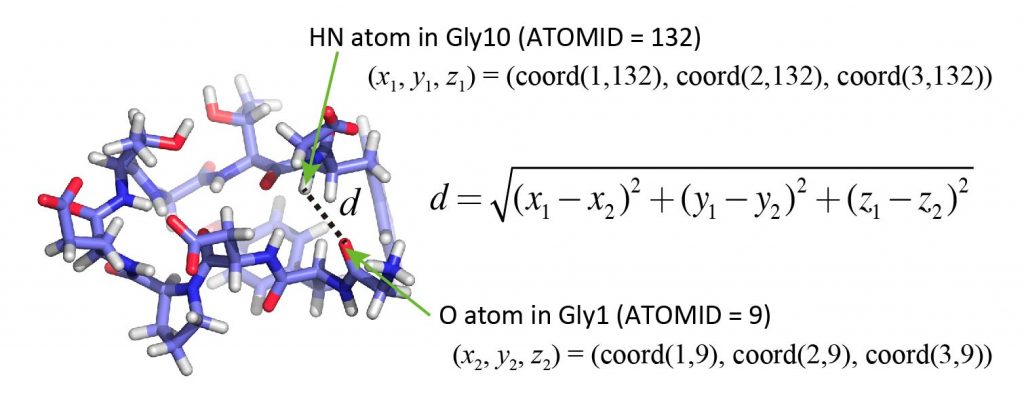
Now, we analyze the distance between the HN atom of Gly10 and the O atom of Gly1, whose ATOMIDs are 132 and 9, respectively (see PDB file). In the sample program, you can see that the coordinates of the atoms in one snapshot are stored in the variable “coord“. Here, coord is an array, and the x-, y-, and z-coordinates of the i-th atom are stored in coord(1,i), coord(2,i), and coord(3,i), respectively. The distances can be calculated using the usual formula using square root (sqrt).
Let’s edit the program. You can use any text editor (vi, emacs, gedit, etc.) you like. Add the following parts in red to the sample program. Do not copy and paste the code! Think about the meaning of each line and type it all in.
:
  integer              :: i, natom, atm1, atm2
  integer(4)           :: dcdinfo(20), ntitle
  real(4), allocatable :: coord(:,:)
  real(8)              :: boxsize(1:6), dist, dx, dy, dz
:
  allocate(coord(1:3,1:natom))

  atm1 = 132
  atm2 = 9
  do i = 1, dcdinfo(1)
    read(10) boxsize(1:6)
:
    ! Analyze the snapshot here
    dx   = coord(1,atm1) - coord(1,atm2)
    dy   = coord(2,atm1) - coord(2,atm2)
    dz   = coord(3,atm1) - coord(3,atm2)
    dist = dsqrt(dx*dx + dy*dy + dz*dz)

    write(20,*) i, dist
  end do
  close(10)
:
Then, compile the source code and run the program. Since we specified “write(20,*)” in the program, the result will be output to a new file “fort.20“. Since fort.20 is a text file, you can check the contents with the less command, or plot the data with Gnuplot. You should also look at the structure of the peptide in VMD to see if the plotted data actually reflects the results.
# Compile the sample program
$ gfortran sample.f90
$ ls
a.out  ionized.pdb  run.dcd  sample.f90

# Execute the program
$ ./a.out
$ ls
a.out  fort.20  ionized.pdb  run.dcd  sample.f90
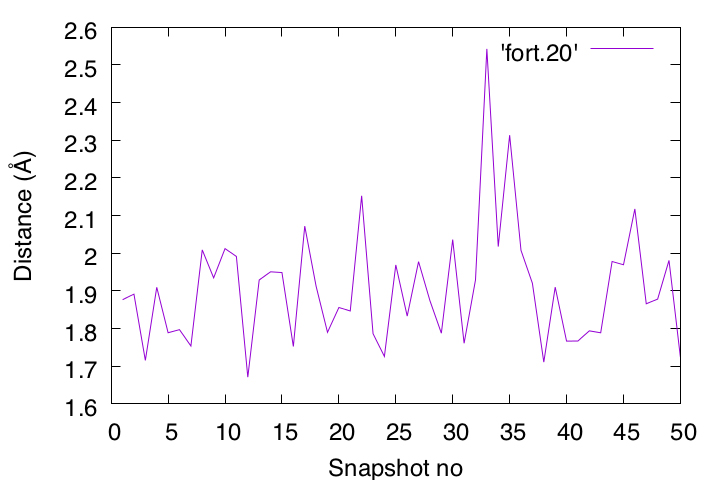
If there is a discrepancy between the “data plotted in gnuplot” and the “structure displayed in VMD“, there may be a bug in your program. To find such a bug, your “sense as a chemist” is also important. In this case, we are analyzing atom pairs that can form hydrogen bonds, and thus, basically the distance should be less than 2.5Å. If it exceeds 2.5 Å, look at the snapshot in VMD to see what happened in the simulation. If such a snapshot still shows hydrogen-bonding formation, you should suspect the program. It is very important to do these double and triple checks to confirm the results.
References
- http://www.mrao.cam.ac.uk/~rachael/compphys/SelfStudyF95.pdf (English)
- https://www.nag-j.co.jp/fortran/ (Japanese)
Written by Takaharu Mori@RIKEN Theoretical molecular science laboratory
Feb. 24, 2022