3.1.11.3. Instant Performance Profiler
The Instant Performance Profiler measures and outputs statistical information for the entire program through sampling analysis.
3.1.11.3.1. Overview
Instant Performance Profiler is composed of 2 commands: fipp command that measures profile data and fipppx command that outputs profile result from measured data. The statistical information that can be output by the Instant Performance Profiler is as follows.
Statistical time information
CPU performance characteristics
Cost information
Call graph information
Source code information
The flow of using the Advanced Performance Profiler is as follows.
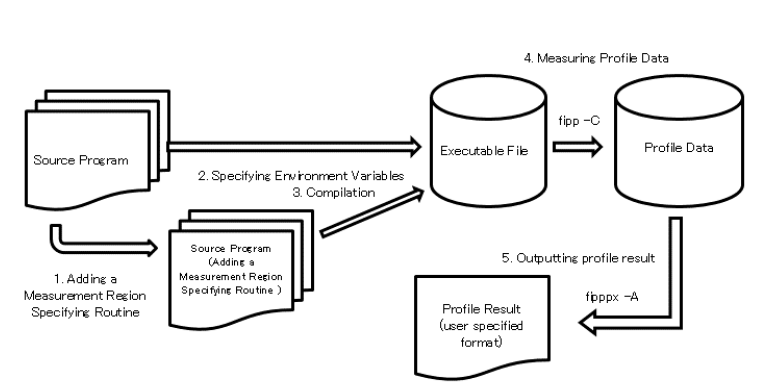
3.1.11.3.2. Addition of measurement interval specification routine
Language type
Header file
Sub routine / function name
Argument
Function
Fortran
None
None
C/C++
fj_tool/fipp.h
None
Attention
To collect measurement data using these subroutines / functions, specify
-Sregionoption tofippcommand.When calling these subroutines / functions multiple times, be sure to call them in the order fipp_start and flipp_stop. If fipp_start is called again before calling fipp_stop, or if fipp_stop is called before calling fipp_start, a warning message is printed and the call is ignored. Also, if the process ends without calling fipp_stop, profile data for that section is not measured.
When these subroutines / functions are called multiple times, the results of all specified measurement intervals are added together.
For MPI programs, call these subroutines / functions in all processes that you want to measure. It does not measure profile data for processes that have not been called.
An example of using the measurement interval specification routine is shown below.
Fortran example
Sample specification example
program main
...
do i=1,10000
  ...
  call fipp_start   ! Start measurring
  do j=1,10000
  ...
  end do
  call fipp_stop    ! End measurring
end do
end program main
Example of measuring all processes (measurement starts before calling the mpi_init subroutine)
call fipp_start     ! Start measurring
call mpi_init(err)
...
call mpi_finalize(err)
call fipp_stop      ! End measurring
Example of measuring all processes (measurement starts immediately after calling the mpi_init subroutine)
call mpi_init(err)
call fipp_start     ! Start measurring
...
call fipp_stop      ! End measurring
call mpi_finalize(err)
Example of measuring only process 0
call mpi_init(err)
call mpi_comm_rank(mpi_comm_world,rank,err)
if(rank==0) then
  call fipp_start   ! Only process 0, start measurring
end if
  ...
if(rank==0) then
  call fipp_stop    ! Only process 0, end measurring
end if
call mpi_finalize(err)
C/C++ example
Sample specification example
#include "fj_tool/fipp.h" // Include header file
...
int main(void)
{
  int i,j;
  for(i=0;i<10000;i++){
    ...
    fipp_start();   // Start measurring
    for(j=0;j<10000;j++){
       ...
    }
    fipp_stop();    // End measurring
  }
  return 0;
}
Example of measuring all processes (start measurement before calling the MPI_Init function)
fipp_start();       // Start measurring
MPI_Init(&argc, &argv);
...
MPI_Finalize();
fipp_stop();        // End measurring
Example of measuring all processes (measurement starts immediately after calling the MPI_Init function)
MPI_Init(&argc, &argv);
fipp_start();       // Start measurring
...
fipp_stop();        // End measurring
MPI_Finalize();
Example of measuring only process 0
MPI_Init(&argc, &argv);
MPI_Comm_rank(MPI_COMM_WORLD, &rank);
if(rank==0){
  fipp_start();     // Only process 0, start measurring
}
...
if(rank==0){
  fipp_stop();      // Only process 0, end measurring
}
MPI_Finalize();
3.1.11.3.3. Compiling / Linking
Compile / link example (MPI program)
[_LNlogin]$ mpifrtpx -Kfast,parallel "Source file name"
Compile / link example (sequential / thread parallel program)
[_LNlogin]$ frtpx -Kfast,parallel "Source file name"Attention
When split compilation is performed, the optimization options specified at compile time should also be specified at link time so that the library of the appropriate profiler is linked. For example, in the case of a program that uses OpenMP, specify
-Kopenmpoption when linking.
3.1.11.3.3.1. About Fortran translation options
Option
Description
-Nfjprof
Combine tool library. When omitted,
-Nfjprofis enabled.-Nnofjprof
Do not combine tool library. Cannot use profiler.
3.1.11.3.3.2. About C/C++ translation options
Mode
Option
Description
trad
-Nfjprof
Combine tool library. When omitted,
-Nfjprofis enabled.trad
-Nnofjprof
Do not combine tool library. Cannot use profiler.
clang
-ffj-fjprof
Combine tool library. When omitted,
-ffj-fjprofis enabled.clang
-ffj-no-fjprof
Do not combine tool library. Cannot use profiler.
3.1.11.3.4. Measurement of profiler data
This indicates execution example of fipp command.
[Condition]
fippcommand is added to the point where the execution module (a.out) is specified.Gather the data to the directory (
profiling_data) where specified with-doption.[MPI program]
#!/bin/sh
#
#PJM -L "node=2x2x2"
#PJM -L "elapse=01:00:00"
#PJM -x PJM_LLIO_GFSCACHE=/vol000N
#PJM -g groupname
#PJM -s
#
fipp -C -d profiling_data -Icall,mpi mpiexec ./a.out
[Sequential / Thread parallel program]
#!/bin/sh
#
#PJM -L "node=1"
#PJM -L "elapse=01:00:00"
#PJM -x PJM_LLIO_GFSCACHE=/vol000N
#PJM -g groupname
#PJM -s
#

fipp -C -d profiling_data -Icall,cpupa ./a.out
Attention
If proceed the following to the profiler data that is measured by fipp command, we do not guarantee the work result.
Edit profile data
Add, delete, and rename profile data
3.1.11.3.5. Profiler option
We describe fipp command option.
Option
Description
Specifies measurement of profile data. If this option is omitted, an error message is output and the execution of the program ends.
profile_data, specify the directory name for storing the profile data as a relative or absolute path. The specified directory must be new or empty.When analyzing a program that moves the current directory during execution,profile_datais specified as an absolute path.The Profiler creates a subdirectory for every 1000 files underprofile_data. Therefore, even for large jobs, you only need to specifyprofile_data.exec-file [ exec_option … ]
Specify the executable file and options for profile data measurement. If MPI program, specify from mpiexec.
-H[mode={all|user}]
Specify the measurement details of the CPU operation status. Specify one of those:
alloruserto sub optionmode=. When omitted this option or sub optionmode={all|user},mode=allis enabled.
- mode=all
Performs measurement in kernel mode and user mode.
- mode=user
Performs information measurement in user mode.
call|nocall} | {cpupa|nocpupa} | {mpi|nompi}}
- call:
Gather Call graph information.
- nocall:
Do not gather Call graph information. When omitted,
nocallis enabled.- cpupa:
Measures the CPU performance characteristics. When omitted,
cpupais enabled.- nocpupa:
Do not measure the CPU performance characteristics.
- mpi:
Measures the MPI Cost information. When omitted when the target is an MPI program
mpiis enabled.- nompi:
Do not measures the MPI Cost information.When omitted when the target is an MPI program
nompiis enabled.-i interval
Specify the sampling interval for measuring profile data. interval specifies the sampling interval as an integer (in milliseconds). When this option is omitted,
-i 100option will be enabled. Specify an integer value in the range of 10 to 3,600,000 tointerval.-L{shared | noshared}
Specify how to measure the generated shared library that the translation option
-Nlineor-ffj-lineis specified.
- shared
The following information in the shared library with line information is measured.
Starting line number of the procedure
End line number of the procedure
Loop cost distribution information
Line cost distribution information
- noshared
The above information in the shared library with line information is not measured. When omitted,
nosharedis enabled.-l limit
__other__.When omitted this option,-l 0option is enabled. Specify an integer value in the range of 0 to 2,147,483,647 tolimit. If specified 0 tolimit, measure the entire.-m memsize
-m 3000option is enabled. Specify an integer value in the range 1 to 2,147,483 tomemsize.-P{userfunc | nouserfunc}
This option specifies how to appropriate the procedure cost. It applies to a mix of an object for which the compiler option
-Nlineor-ffj-lineis specified (object with line information) and an object for which the compiler option-Nnolineor-ffj-no-lineis specified (object without line information). The standard library and a shared library when-Lnosharedis specified are handled as objects without line information.
- userfunc
If a cost is appropriated to a procedure of the object without line information, the procedure that called the procedure of the object without line information is traced back from call graph information. If a procedure of the object with line information exists, the cost is appropriated to the procedure. If no procedures of the object with line information exist, the cost is not appropriated. When specifying the
-Puserfuncoption, you must specify the-Icalloption at the same time. If you do not specify the-Icalloption, an error message is output and the collecting command is terminated.- nouserfunc
If a cost is appropriated to a procedure of the object without line information, the cost is appropriated to the procedure. However, the procedure start and end lines are not output.
-S{all | region}
Specify the measurement interval for profile data.
- all
Measure the entire program. When omitted,
allis enabled.- region
Measures the section specified by the measurement section specification routine. A measurement interval specification routine must be inserted in the source code.
-W{spawn|nospawn}
Specify the measurement method for dynamically generated processes. When omitted and specified, if it is MPI program,
-Wspawnis enabled and if it is not MPI program,-Wnospawnis enabled.
- spawn
Measure dynamically generated process statistics
- nospawn
Does not measure dynamically generated process statistics
3.1.11.3.6. Output profile result
An execution example is shown below of fipppx command.
- If it’s login node
Use fipppx command.
- If it’s computing node
Use fipp command.
[Command execution example]
[_LNlogin]$ fipppx -A -pall -Ibalance,call -d profiling_data
In this example, output of all process information is specified ( -p all). As a result of high parallel execution, if all processes are targeted for output, the output may be enormous. If you know in advance what process to focus on, you can also output by specifying the process number like -p0,1 (Process 0 and 1) .
3.1.11.3.6.1. fipppx command option
Option |
Function / measurement value (unit) |
|---|---|
-A
(Required option)
|
Specify output processing of profile results. |
-d profile_data
(Required option)
|
Specify the directory where the profile data is stored in profile_data as a relative or absolute path. |
-f func_name |
Specify the name of the procedure used by the program in func_name, output information about func_name.
However if does not measure information about the process of func_name by fipp command, or func_name process cost is 0, information will not be output even specified
ffunc_name. |
-Iitem
(Hyphen + capital letter I)
|
Specify the items to be output as profile results.
If specify the multiple item, devide with comma.
item:{{
balance | nobalance}|} | {call | nocall}|} | {cpupa | nocpupa}|} | {mpi | nompi} | {src[:path ] | nosrc}}}}
|
-l limit
(Lowercase l)
|
Specify the number of procedure information items to be output.
When this option is omitted,
-l 10 option is enabled.Specify an integer value in the range of 0 to 2,147,483,647. to limit. If specified 0 to limit, the entire will be output.
|
-o outfile |
Specify the output destination of the profile result. For outfile, specify the output file name as a relative or absolute path, or specify “stdout”.
When this option is omitted,
-ostdout option is enabled. |
-pp_no |
Specify the process to be output to the profile result.
To p_no , specify one of these :
N, input=n, limit=m, all.When this option is omitted,
-pinput=0, limit=16 option is enabled. To -p option, as comma (,) as devision, p_no can specified multiply.For example, it can be like this :
-p3,5,limit=10.
|
-Tt_no |
Specify the thread to output profile data.
To t_no , specifiy one of these:
N, limit=n, all. To -T option, as comma (,) as devision, t_no can specified multiply.For example, it canbe :
-T3,5,limit=10.
|
-t{text|xml} |
Specify the output format of the profile result.
|
3.1.11.3.6.2. Profile result
-I option of fipppx command.Profile data measurement environment information
Statistical time information
CPU performance characteristics
Cost information (procedure cost distribution information, loop cost distribution information, line cost distribution information)
Call graph information
Source code information