3.1.11.2. Advanced Performance Profiler
The Advanced Performance Profiler measures and outputs the execution performance information of the specified section of the application.
3.1.11.2.1. Overview
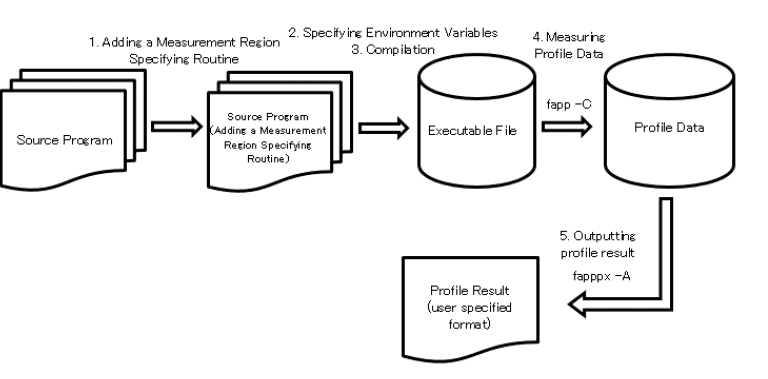
Advanced Performance Profiler is composed of 2 commands: fapp command that measures profiler data and fapppx command that output the profile result from measured data. The information that the Advanced Performance Profiler measures and outputs is as follows.
Statistical time information
MPI communication cost information
CPU performance analysis information
The flow of using the Advanced Performance Profiler is as follows.
3.1.11.2.2. Addition of measurement interval specification routine
Language type
Header file
Sub routine / function name
Argument
Function
Fortran
None
(name, number, level)
C/C++
fj_tool/fapp.h
(const char *name, int number, int level)
[Argument details]
Argument
Description
name
Group name (basic character scalar). A group name consists of letters, numbers, and underscores. Other characters cannot be used.
number
Detail number (4-byte integer type)
level
Priority level (4-byte integer type 0 or greater integer)
Note
The group name and detail number are used to distinguish them as measurement range names. If the priority level is higher than fapp command’s
-Loption, do not proceed measurement.Attention
When calling subroutines / functions with the same measurement section name multiple times, be sure to call them in the order fapp_start and fapp_stop. If fapp_start is called again before calling fapp_stop, or if fapp_stop is called before calling fapp_start, a warning message is output and the call is ignored.
If the measurement section names are different, there is no problem if fapp_start or fapp_stop continues.
If the process ends without calling fapp_stop, the profile data for that section is not measured.
If the measurement for the same measurement section name is performed multiple times, all the measurement results are added.
Specify the same value for the argument level for fapp_start and fapp_stop. If you specify a different value, depending on specification of fapp command’s
-Loption , unintended results may occur.If specify “all” to argument
nameand 0 tonumber,it covers the entire program.In the case of an MPI program, call a subroutine / function with the same measurement section name in all processes to be measured. Profile data for processes that have not been called is not counted.
An example of using the measurement interval specification routine is shown below.
Fortran example
Sample specification example
program main
...
call fapp_start("foo",1,0)         ! Start measurement of measurement section name "foo1"
do i=1,10000
  ...
  call fapp_start("bar",1,0)       ! Start measurement of measurement section name "bar1"
  do j=1,10000
   ...
  end do
  call fapp_stop("bar",1,0)        ! End measurement of measurement section name "bar1"
end do
call fapp_stop("foo",1,0)          ! End measurement of measurement section name "foo1"
end program main
Example of measuring all processes (measurement starts before calling the mpi_init subroutine)
call fapp_start("foo",1,0)         ! Start measurring
call mpi_init(err)
...
call mpi_finalize(err)
call fapp_stop("foo",1,0)          ! End measurring
Example of measuring all processes (measurement starts immediately after calling the mpi_init subroutine)
call mpi_init(err)
call fapp_start("foo",1,0)         ! Start measurring
...
call fapp_stop("foo",1,0)          ! End measurring
call mpi_finalize(err)
Example of measuring only process 0
call mpi_init(err)
call mpi_comm_rank(mpi_comm_world,rank,err)
if(rank==0) then
  call fapp_start("foo",1,0)       ! Only process 0, start measurring
end if
  ...
if(rank==0) then
  call fapp_stop("foo",1,0)        ! Only process 0, end measurring
end if
call mpi_finalize(err)
C/C++ example
Sample specification example
#include "fj_tool/fapp.h"          // Include header file
...
int main(void)
{
  int i,j;
  fapp_start("foo",1,0);           // Start measuring the measurement section name "foo1"
  for(i=0;i<10000;i++){
    ...
    fapp_start("bar",1,0);         // Start measuring the measurement section name "bar1"
    for(j=0;j<10000;j++){
       ...
    }
    fapp_stop("bar",1,0);          // End measuring the measurement section name "bar1"
  }
  return 0;
  fapp_stop("foo",1,0);            // End measuring the measurement section name "foo1"
}
Example of measuring all processes (start measurement before calling the MPI_Init function)
fapp_start("foo",1,0);             // Start measurring
MPI_Init(&argc, &argv);
...
MPI_Finalize();
fapp_stop("foo",1,0);              // End measurring
Example of measuring all processes (measurement starts immediately after calling the MPI_Init function)
MPI_Init(&argc, &argv);
fapp_start("foo",1,0);             // Start measurring
...
fapp_stop("foo",1,0);              // End measurring
MPI_Finalize();
Example of measuring only process 0
MPI_Init(&argc, &argv);
MPI_Comm_rank(MPI_COMM_WORLD, &rank);
if(rank==0){
  fapp_start("foo",1,0);           // Only process 0, start measurring
}
...
if(rank==0){
  fapp_stop("foo",1,0);            // Only process 0, end measurring
}
MPI_Finalize();
3.1.11.2.3. Compiling / Linking
Compile / link example (MPI program)
[_LNlogin]$ mpifrtpx -Kfast,parallel "Source file name"
Compile / link example (sequential / thread parallel program)
[_LNlogin]$ $ frtpx -Kfast,parallel "Source file name"Attention
When split compilation is performed, the optimization options specified at compile time should also be specified at link time so that the library of the appropriate profiler is linked.
For programs using OpenMP, specify
-Kopenmpoption when linking.
3.1.11.2.3.1. About Fortran translation options
Option
Description
-Nfjprof
-Nfjprofis enabled.-Nnofjprof
3.1.11.2.3.2. About C/C++ translation options
Mode
Option
Description
trad
-Nfjprof
-Nfjprofis enabled.trad
-Nnofjprof
clang
-ffj-fjprof
-ffj-fjprofis enabled.clang
-ffj-no-fjprof
3.1.11.2.4. Measurement of profile data
#!/bin/bash -x
#
#PJM -L "node=8"
#PJM -L "elapse=01:00:00"
#PJM -x PJM_LLIO_GFSCACHE=/vol000N
#PJM -g groupname
#PJM -s
#

LD="./sample_mpi"
MPIEXEC="mpiexec"
#
fapp -C -d ./tmp -Icpupa,mpi -Hevent=statistics ${MPIEXEC} ${LD}
Attention
If proceed the following to the profiler data that is measured by fapp command, we do not guarantee the work result.
Edit profile data
Add, delete, and rename profile data
3.1.11.2.5. Profiler option
We describe fapp command option.
Option
Description
Specifies measurement of profile data. If this option is omitted, an error message is output and the execution of the program ends.
profile_data, specify the directory name for storing the profile data as a relative or absolute path. The specified directory must be new or empty.When analyzing a program that moves the current directory during execution,profile_datais specified as an absolute path.The Profiler creates a subdirectory for every 1000 files underprofile_data. Therefore, even for large jobs, you only need to specifyprofile_data.-Hitem
-Inocpupaoption is specified, a warning message is output and this option is disabled.item:{event=event | event_raw=event_raw } [,method={fast | normal},mode={all | user}]
- event=event
Measures information used for CPU Performance Analysis Reports. Specify one of the following for event .
{ pa1 | pa2 | pa3 | pa4 | pa5 | pa6 | pa7 | pa8 | pa9 | pa10 | pa11 | pa12 | pa13 | pa14 | pa15 | pa16 | pa17 | statistics}
- event_raw=event_raw
CPU performance analysis information is measured by specifying the event number of PMU event information. event_raw specifies the event number corresponding to the CPU in decimal or hexadecimal notation. Up to 8 event_raw can be specified by separating them with a comma (,).
- method=fast
Specify the measurement method for CPU performance analysis information. When this suboption is specified, high-precision CPU performance analysis information is measured by a method that directly measures hardware information.
- method=normal
Specify the measurement method for CPU performance analysis information. When this suboption is specified, CPU performance analysis information is measured by the method of measuring via the OS. When omitted, it will be
method=normal.- mode=all
Specify the measurement mode for CPU performance analysis information. When this suboption is specified, performance is measured in kernel mode and user mode.
- mode=user
Specify the measurement mode for CPU performance analysis information. When this suboption is specified, performance measurement is performed in user mode.
cpupa|nocpupa} | {mpi|nompi}}Operation when this option is omitted depends on the item to be measured.For CPU performance characteristics measurement, if-Hoption is specified,-Icpupais enabled, if-Hoption is not specified,-Inocpupais enabled.For MPI Cost information measurement, if target is MPI program,mpiis enabled, if target is unti MPI program,nompiis enabled.
- cpupa:
Measures the CPU performance characteristics.
- nocpupa:
Do not measures the CPU performance characteristics.
- mpi:
Measures MPI Cost information.
- nompi:
Does not measures MPI Cost information.
-L level
-L 0is enabled.exec-file [ exec_option … ]
Specify the executable file and options for profile data measurement. For MPI programs, specify from mpiexec.
3.1.11.2.6. Output profile result
An execution example is shown below of fapppx command.
- If it’s login node
Use fapppx command.
- If it’s computing node
Use fapp command.
[Command execution example]
[_LNlogin] $ fapppx -A -pall -o tmp.txt -d Fprofd_stati
In this example, output of all process information is specified ( -p all).
Also, it is able to output the input file used for the CPU Performance Analysis Report to -tcsv option.
3.1.11.2.6.1. fapppx command option
Option |
Function / measurement value (unit) |
|---|---|
-A
(Required option)
|
Specify output processing of profile results. |
-d profile_data
(Required option)
|
Specify the directory where the profile data is stored in profile_data as a relative or absolute path. |
-Iitem
(Hyphen + capital letter I)
|
Specify the items to be output as profile results.
f specify the multiple item, devide with comma.
item:{{
cpupa | nocpupa}|} | {mpi | nompi}}
|
-o outfile |
Specify the output destination of the profile result. For outfile, specify the output file name as a relative or absolute path, or specify “stdout”.
When this option is omitted,
-ostdout option is enabled. |
-p p_no |
Specify the process to be output to the profile result.
To p_no , specify one of these :
N, input=n, limit=m or all.When this option is omitted,
-pinput=0 and limit=16 option is enabled. To -p, as comma (,) as devision, p_no can specified multiply.For example, it can be like this :
-p3,5,limit=10.
|
-t{csv | text} |
Specify output format to the profile result.
|
3.1.11.2.6.2. Profile result
-I option of fapppx command.Profile data measurement environment information
Statistical time information
MPI communication cost information
CPU performance analizying information