hb_analysis
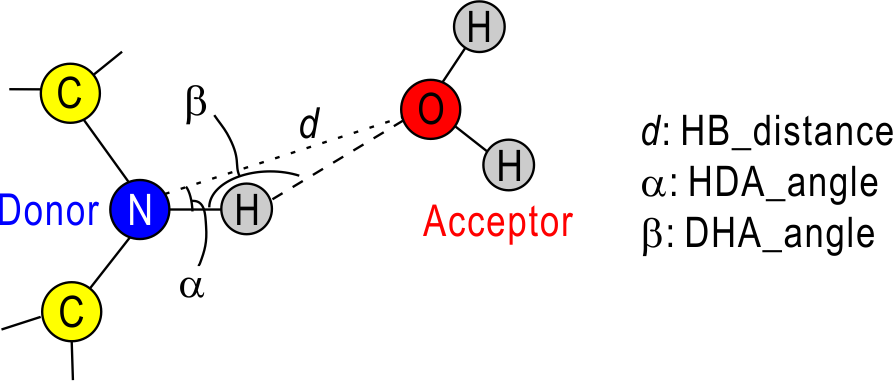
This tool is used to examine H-bonds formed in the selected two atom groups. For the detection of H-bonds, we need the three geometrical parameters: hb_distance (d), HDA_angle (α), and DHA_angle (β). In the default, d = 3.4 Å, α = 30.0 deg. and β = 120.0 deg. If you use your own definition, you can change these values in [OPTION] section. In the current version, H-bonds are examined only for nitrogen or oxygen atoms.
This tool has two calculation options: CountSnap and CountAtom. In this sample page, we illustrate samples for these two options.
case 1: Count the number of H-bonds formed in every snapshot
When output_type = Count_snap, the number of H-bonds formed between ‘analysis_atom‘ and ‘target_atom‘ groups is output per snapshot used for the analysis. When boundary_type = PBC, the examination of H-bonds is done taking account of PBC.
[INPUT]
psffile  = BPTI_ionize.psf
reffile  = BPTI_ionize.pdb

[OUTPUT]
txtfile     = BPTI_internal_water_hbonds.txt
hb_listfile = BPTI_internal_water_hbonds.list

[TRAJECTORY]
trjfile1      = run.dcd
md_step1      = 10
mdout_period1 = 1
ana_period1   = 1

trj_format    = DCD
trj_type      = COOR+BOX

[SELECTION]
group1        = sid:BPTI & resno:1-58
group2        = resname:TIP3 & resno:2065

[OPTION]
check_only    = NO
output_type   = Count_Snap   # number of H-bonds are output per snapshot
analysis_atom = 1
target_atom   = 2
boundary_type = PBC
hb_distance   =   3.4
dha_angle     = 120.0
hda_angle     =  30.0
When ‘hb_listfile‘ name is specified in [OUTPUT] section, the H-bond list is generated. When using the control file above, the ’hb_listfile‘ will be as follows:
# snapshot | info for analysis atom   .. info for target_atom     | HB_dis  DHA_ang  HDA_ang
         1 | O    PHE          4 BPTI .. OH2  TIP3      2065 WT1  |  2.629  167.111    8.231
         1 | OE2  GLU          7 BPTI .. OH2  TIP3      2065 WT1  |  2.796  160.046   13.244
         1 | N    ASN         43 BPTI .. OH2  TIP3      2065 WT1  |  3.119  140.923   27.451
         2 | O    PHE          4 BPTI .. OH2  TIP3      2065 WT1  |  2.877  162.791   11.560
         2 | OE2  GLU          7 BPTI .. OH2  TIP3      2065 WT1  |  3.099  154.963   17.526
         2 | N    ASN         43 BPTI .. OH2  TIP3      2065 WT1  |  3.141  138.608   29.278
    ......
In hb_listfiles, snapshot numbers are written in the leftmost column. In the 2nd-9th columns, atom name, residue name, residue number and segment name are respectively written both for the ‘analysis atom’ and the ‘target atom’. The 1st – 3rd columns from the right in the list represent the geometry of the H-bonds: H-bond distance, DHA_angle and HDA_angle.
case 2: Examine the frequency of H-bond formation during the trajectory
When output_type = Count_atom, the frequency of H-bond formation between ‘analysis_atom‘ and ‘target_atom‘ groups is output for each H-bond pair.
[INPUT]
psffile  = BPTI_ionize.psf
reffile  = BPTI_ionize.pdb

[OUTPUT]
txtfile     = BPTI-external_water_H-bonds.txt

[TRAJECTORY]
trjfile1      = run.dcd
md_step1      = 10
mdout_period1 = 1
ana_period1   = 1
trj_format    = DCD
trj_type      = COOR+BOX

[SELECTION]
group1        = sid:BPTI & resno:35
group2        = resname:TIP3

[OPTION]
check_only    = NO
output_type   = Count_atom  # number of H-bonds is output per each H-bond pair
analysis_atom = 1
target_atom   = 2
solvent_list = TIP3 DPPC    # residue names of solvent molecules
                            # (Here, DPPC is added to show how to list more than one solvent type)
boundary_type = PBC
hb_distance   =   3.4
dha_angle     = 120.0
hda_angle     =  30.0
The option ‘solvent_list‘ is used not to distinguish individual solvent molecules (i.e. water or lipid molecules) in examining the frequency of the H-bond formation between protein and solvent molecules. For example, when you use the control file above, the output file will be as follow:
15 | OH TYR 35 BPTI .. OH2 TIP3
In the output files, the leftmost column represents the total number of the H-bonds between BPTI Tyr35 OH atoms and water molecules during the 10 snapshots used in the analysis.
On the other hand, when ‘solvent_list‘ is blank or not specified, the output file will be as follows:
         1 | OH   TYR         35 BPTI .. OH2  TIP3       863 WT1
         1 | OH   TYR         35 BPTI .. OH2  TIP3      1932 WT1
         1 | OH   TYR         35 BPTI .. OH2  TIP3      2224 WT1
         2 | OH   TYR         35 BPTI .. OH2  TIP3      2648 WT1
         1 | OH   TYR         35 BPTI .. OH2  TIP3      3988 WT1
         1 | OH   TYR         35 BPTI .. OH2  TIP3      4589 WT1
         1 | OH   TYR         35 BPTI .. OH2  TIP3      5122 WT1
         1 | OH   TYR         35 BPTI .. OH2  TIP3      6152 WT1
         1 | OH   TYR         35 BPTI .. OH2  TIP3      7402 WT1
         1 | OH   TYR         35 BPTI .. OH2  TIP3      8250 WT1
         1 | OH   TYR         35 BPTI .. OH2  TIP3      9245 WT1
         1 | OH   TYR         35 BPTI .. OH2  TIP3      4244 WT2
         1 | OH   TYR         35 BPTI .. OH2  TIP3      4476 WT3
         1 | OH   TYR         35 BPTI .. OH2  TIP3      8023 WT7
In the output files, the leftmost column represents the total number of the H-bonds between BPTI Tyr35 OH atoms and each water molecule during the 10 snapshots used in the analysis.